Answering Questions about Charts and Generating Visual Explanations
Abstract
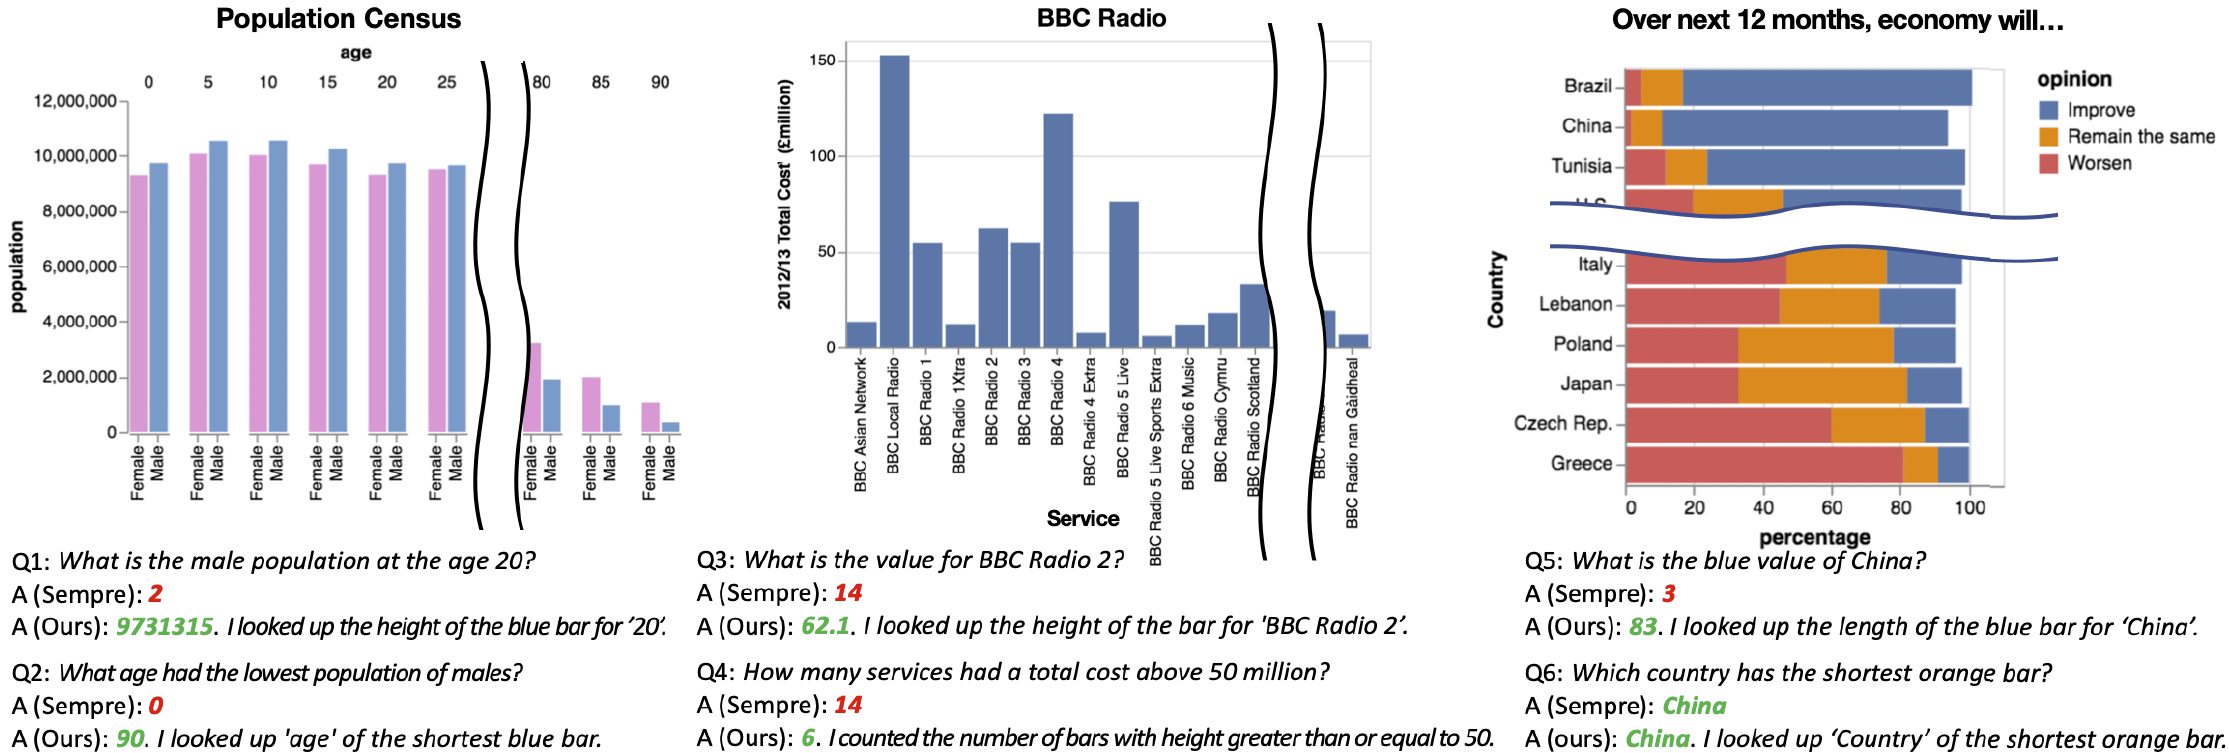
People often use charts to analyze data, answer questions and explain their answers to others. In a formative study, we find that such human-generated questions and explanations commonly refer to visual features of charts. Based on this study, we developed an automatic chart question answering pipeline that generates visual explanations describing how the answer was obtained. Our pipeline first extracts the data and visual encodings from an input Vega-Lite chart. Then, given a natural language question about the chart, it transforms references to visual attributes into references to the data. It next applies a state-of-the-art machine learning algorithm to answer the transformed question. Finally, it uses a template-based approach to explain in natural language how the answer is determined from the chart’s visual features. A user study finds that our pipeline-generated visual explanations significantly outperform in transparency and are comparable in usefulness and trust to human-generated explanations.
Paper PDF (4.2MB)
Supplemental PDF (1.1MB)
Dataset & Code GitHub
Video
Bibtex
@inproceedings{kim2020answering,
  author = {Kim, Dae Hyun and Hoque, Enamul and Agrawala, Maneesh},
  title = {Answering Questions about Charts and Generating Visual Explanations},
  year = {2020},
  isbn = {9781450367080},
  publisher = {Association for Computing Machinery},
  address = {New York, NY, USA},
  url = {https://doi.org/10.1145/3313831.3376467},
  doi = {10.1145/3313831.3376467},
  abstract = {People often use charts to analyze data, answer questions and explain their answers to others. In a formative study, we find that such human-generated questions and explanations commonly refer to visual features of charts. Based on this study, we developed an automatic chart question answering pipeline that generates visual explanations describing how the answer was obtained. Our pipeline first extracts the data and visual encodings from an input Vega-Lite chart. Then, given a natural language question about the chart, it transforms references to visual attributes into references to the data. It next applies a state-of-the-art machine learning algorithm to answer the transformed question. Finally, it uses a template-based approach to explain in natural language how the answer is determined from the chart's visual features. A user study finds that our pipeline-generated visual explanations significantly outperform in transparency and are comparable in usefulness and trust to human-generated explanations.},
  booktitle = {Proceedings of the 2020 CHI Conference on Human Factors in Computing Systems},
  pages = {1--13},
  numpages = {13},
  keywords = {explainable ai, visualization, question answering},
  location = {Honolulu, HI, USA},
  series = {CHI '20}
}