Towards Understanding How Readers Integrate Charts and Captions:
A Case Study with Line Charts
Abstract
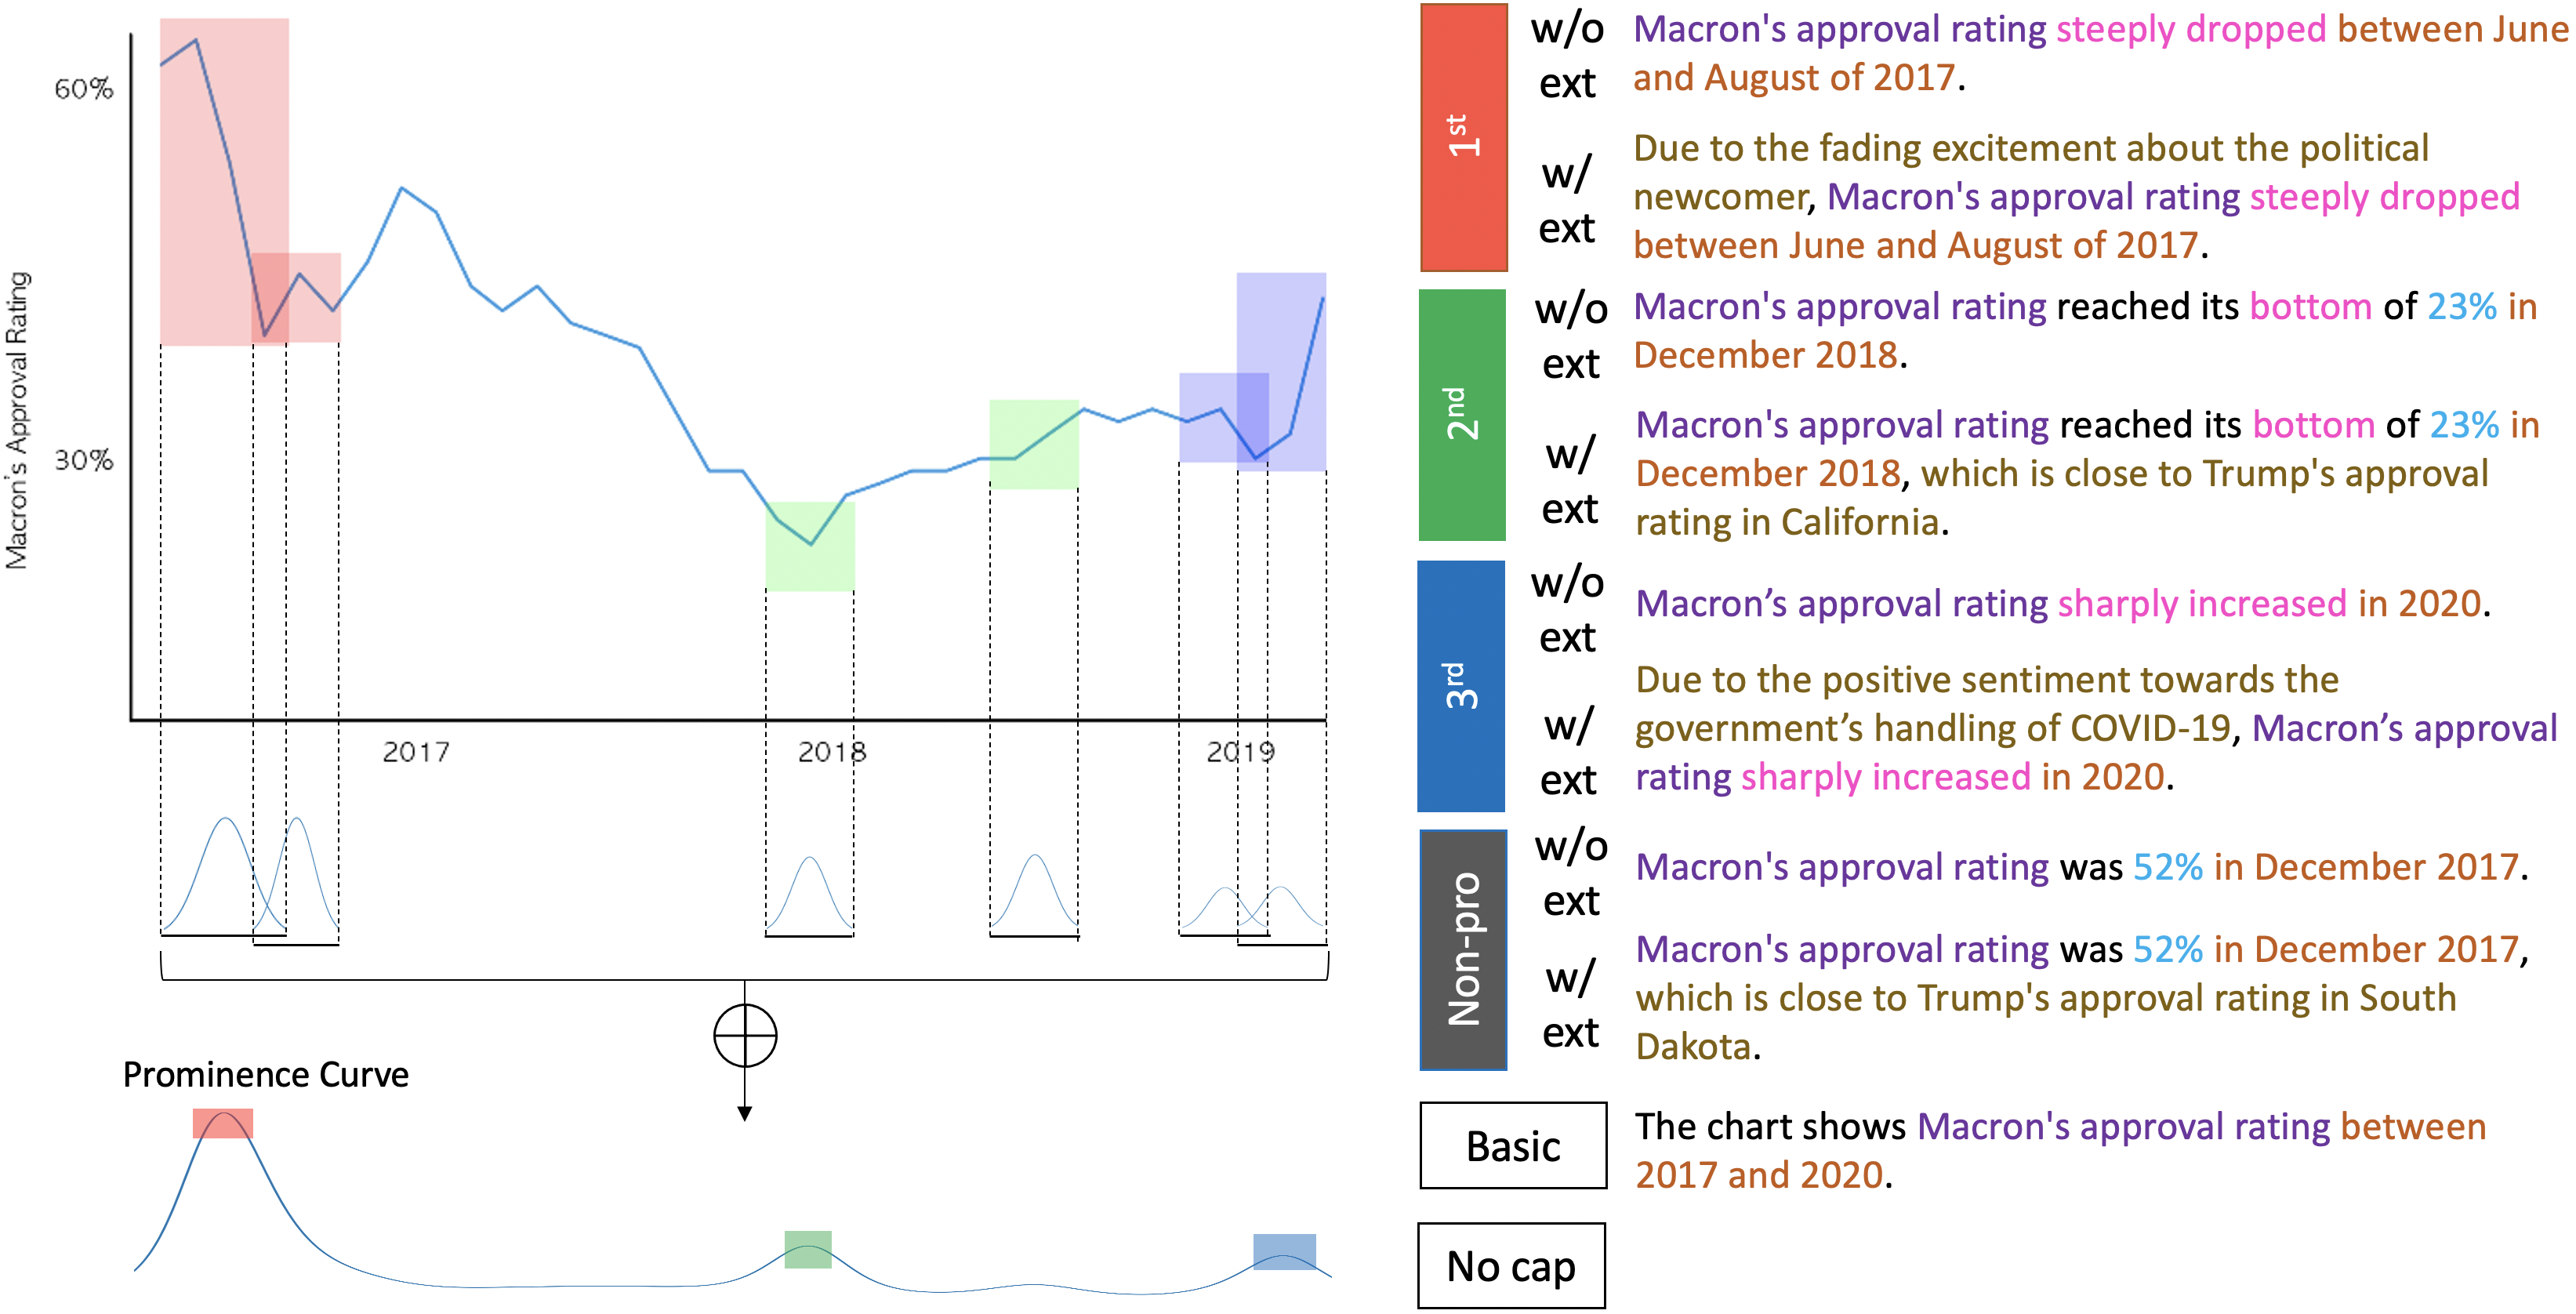
Charts often contain visually prominent features that draw attention to aspects of the data and include text captions that emphasize aspects of the data. Through a crowdsourced study, we explore how readers gather takeaways when considering charts and captions together. We first ask participants to mark visually prominent regions in a set of line charts. We then generate text captions based on the prominent features and ask participants to report their takeaways after observing chart-caption pairs. We find that when both the chart and caption describe a high-prominence feature, readers treat the doubly emphasized high-prominence feature as the takeaway; when the caption describes a low-prominence chart feature, readers rely on the chart and report a higher-prominence feature as the takeaway. We also find that external information that provides context, helps further convey the caption’s message to the reader. We use these findings to provide guidelines for authoring effective chart-caption pairs.
Paper PDF (5.9MB)
Supplemental ZIP (3.0MB)
Video
Bibtex
@inproceedings{kim2021towards,
  author = {Kim, Dae Hyun and Setlur, Vidya and Agrawala, Maneesh},
  title = {Towards Understanding How Readers Integrate Charts and Captions: A Case Study with Line Charts},
  year = {2021},
  isbn = {9781450380966},
  publisher = {Association for Computing Machinery},
  address = {New York, NY, USA},
  url = {https://doi-org.stanford.idm.oclc.org/10.1145/3411764.3445443},
  doi = {10.1145/3411764.3445443},
  booktitle = {Proceedings of the 2021 CHI Conference on Human Factors in Computing Systems},
  articleno = {610},
  numpages = {11},
  keywords = {line charts, visually prominent features, takeaways., Captions},
  location = {Yokohama, Japan},
  series = {CHI '21}
}